Skip to content

A system monitor for Linux · free and open source

Live, recorded and crash‑proof.

sysman samples your CPU, memory, GPUs, disks, network, sensors and processes every two seconds. A native app shows it live and as history, and the last readings before a freeze or power cut are already on disk.

  • No root needed
  • Stays on your machine
  • About 2% of one core
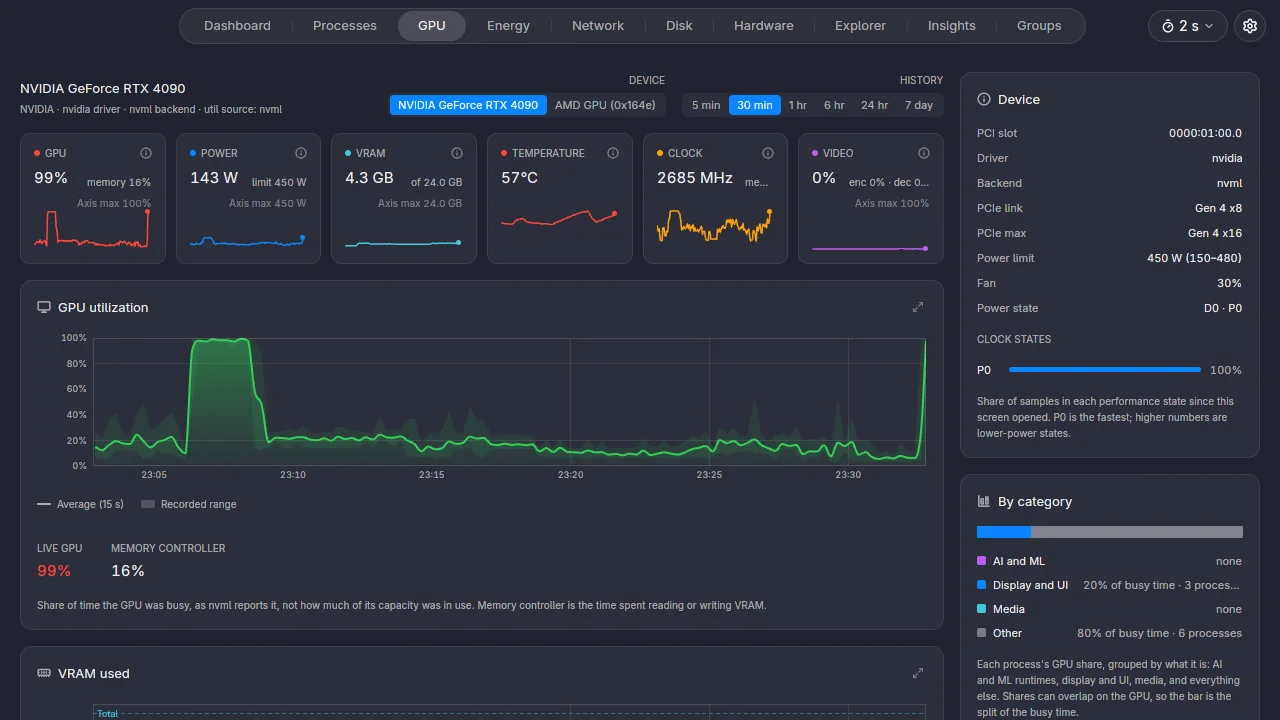
The sysman GPU screen: utilisation, power, VRAM, temperature, clock and video engine cards above a 30-minute utilisation chart, with device details and per-category GPU use in the side rail.

Why sysman

A monitor that keeps watching when you are not.

The collector runs as a small user service whether the app is open or not. Close the window, reboot, lose power: what happened is still there to look at.

Live, every two seconds

CPU, memory, pressure, sensors, GPUs, disks and network every 2 seconds; every process every 10; filesystems, drives and batteries less often. The app subscribes over a local socket and redraws only the tab you are looking at.
Recorded history, years of it

Everything lands in a local SQLite database. Pick any range from five minutes to seven days on any screen, or open Explorer to chart any recorded metric or process side by side. Every process is recorded every 10 seconds, with a week of per-minute history.

  • Every reading full resolution48 hours
  • 1-minute min / avg / max rollups90 days
  • 15-minute min / avg / max rollups2 years

Default retention; each tier is configurable.

A crash log that survives the crash

Every tick is written as one line of JSON and forced to disk before the next tick starts, so a hard freeze or a power cut cannot take the last readings with it. Open the day's file and read what led up to the gap.

  • Temperatures climbing, fans falling: cooling.
  • Flat and normal to the last line: power supply or cabling.
  • A burst of GPU errors first: the GPU or its driver hung.
Reading the log after a crash
$ f=~/.local/share/sysman/log/$(date +%F).jsonl
$ tail -1 "$f" | jq .  # the latest sample
$ jq -c 'select(.type=="sample") | [.time, .cpu.temp_c, .gpu.devices[]?.temp_c]' "$f"
$ jq -c 'select(.errors) | [.time, .errors]' "$f"  # collector failures

Light enough to forget

About 2% of one core with the defaults. Each collector runs on its own thread with a deadline, so a hung GPU driver or a slow sensor never holds up the rest; it is recorded as an error and the tick goes on.

~2%of one core, measured

Screen tour

Ten screens, one native app.

A native Linux app built with GPUI and drawn on the GPU. Every image here is a real screenshot of sysman reading a live collector.

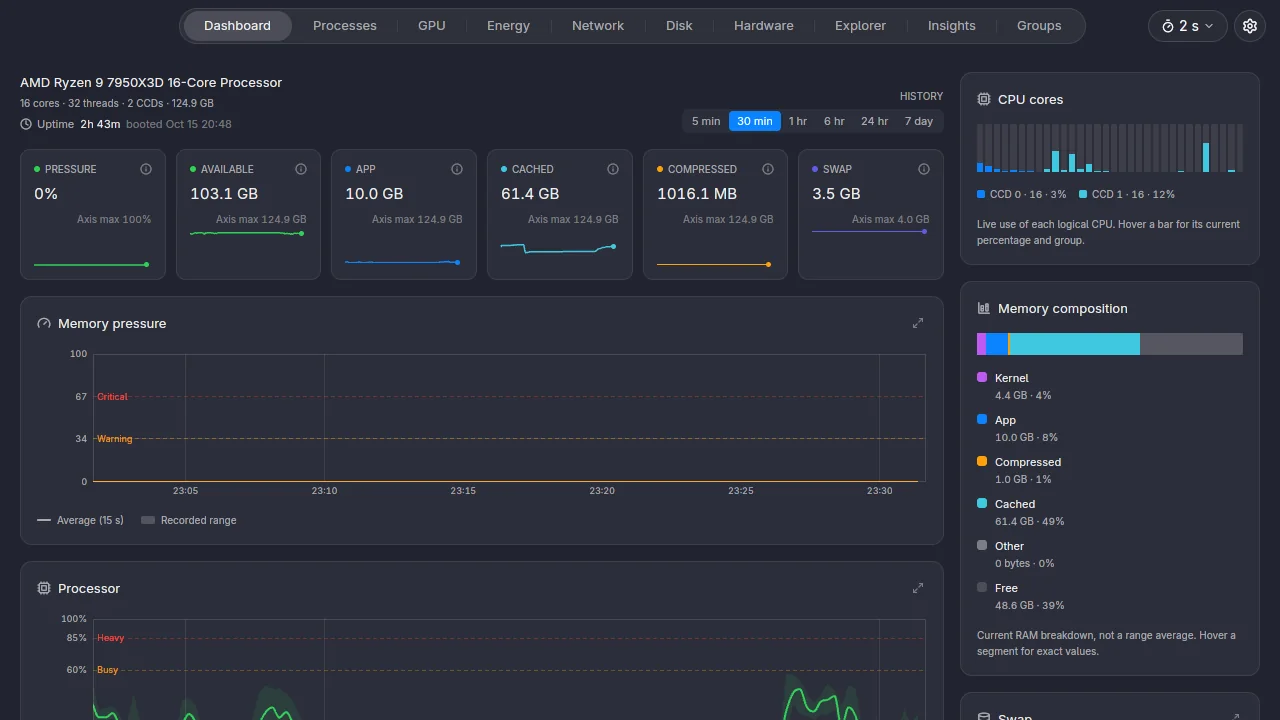
The Dashboard: CPU model and uptime, memory cards for pressure, available, app, cached, compressed and swap, a memory pressure chart, a processor chart, and a rail with per-core CPU bars and memory composition.

The whole machine at a glance

CPU, memory pressure, memory composition, swap, thermals, network and disk on one page, each with its history. Every card and chart opens a detail sheet that explains what the number means and how it is calculated.

Plus Groups: sets of processes you define, such as a browser and its helpers, with their combined memory and CPU over time.

How it works

Three small programs, one job each.

A collector that records, an app that shows, and an optional helper for the few readings Linux keeps behind root.

sysman-helper

optional · system service · off by default

Reads only what needs root: SMART drive health, CPU package power, other users’ disk I/O and open files, and per-process network traffic through eBPF.

Confined by systemd, with no network of its own.

sysmand

collector · systemd user service

Reads /proc, /sys, NVML and hwmon on a fixed tick, each module on its own thread, and writes three things:

  • Crash log

    ~/.local/share/sysman/log/

    JSON Lines, synced every tick, today and yesterday

  • History

    ~/.local/share/sysman/history.db

    SQLite with rollups, opened read-only by readers

  • Live socket

    $XDG_RUNTIME_DIR/sysman.sock

    line-delimited JSON: meta, latest, subscribe, processes

sysman

desktop app · GPUI

Subscribes to the socket for live values and reads history straight from the database. Close it any time; recording does not depend on it.

Wayland or X11, with Vulkan.

Nothing leaves the machine

Live data travels over a Unix socket and history sits in a local file. No account, no telemetry, no network connections.

No root for the essentials

The collector and the app run as you. Values that need root show as “not permitted”, never as a misleading zero.

Your data, in open formats

Query the socket with socat and jq, open the database with any SQLite tool, read the crash log with tail.

Hardware

Vendor-neutral, top to bottom.

NVIDIA, AMD and Intel graphics, and AMD and Intel processors, all land in the same records and the same screens. A machine with GPUs from two vendors shows both.

Backends without hardware on hand are tested against fixture trees built from the kernel documentation, and marked unverified on hardware.

  • AMD and Intel CPUs

    x86-64. AMD through k10temp and zenpower, Intel through coretemp, with hybrid P- and E-cores told apart. Per-core use and frequency, package and per-CCD temperatures, and RAPL power where it is readable.

    Verified on AMD Ryzen 9 7950X3D

  • NVIDIA GPUs

    NVML in-process, switching to nvidia-smi if NVML ever hangs, so a stuck driver is recorded rather than stalling the collector.

    Verified on GeForce RTX 4090

  • AMD GPUs

    amdgpu sysfs and hwmon, with per-process use from DRM fdinfo.

    Verified on a Raphael iGPU

  • Intel GPUs

    i915 and xe sysfs, hwmon, and per-process use from DRM fdinfo.

    Tested against fixtures from kernel documentation

  • Sensors and the rest

    Every hwmon sensor on the board (temperatures, fans, voltages, power), NVMe drives, btrfs, batteries and the batteries of wireless peripherals.

    Any Linux machine that exposes them

Install

Up and recording in a minute.

Packages for Arch and Debian-based systems, a script for everything else. Each one installs the collector, the app with its desktop entry, and the helper, which stays off until you turn it on.

From the AUR: sysman builds the release from source, sysman-bin installs the prebuilt binaries. Use your AUR helper of choice.

$ yay -S sysman  # or sysman-bin
$ systemctl --user enable --now sysmand

Then open sysman from your application menu. To check on the collector:

$ systemctl --user status sysmand
$ sysmand --once  # prints one sample, writes nothing

Optional

Turn on the helper for the last few readings.

Without root, Linux hides SMART drive health, CPU package power on most systems, other users’ disk I/O and open files, and per-process network traffic. sysman-helper reads exactly these and nothing else. It runs as a confined system service with no network, answers only on a socket that administrators can open, and never runs anything a client sends.

Switch on Read privileged data in the app’s Settings, under Advanced; it asks for authentication. Or from a terminal:

$ sudo systemctl enable --now sysman-helper

The socket is open to the wheel group on Arch and to sudo on Debian and Ubuntu. Add yourself to it if you are not in it, and log in again.

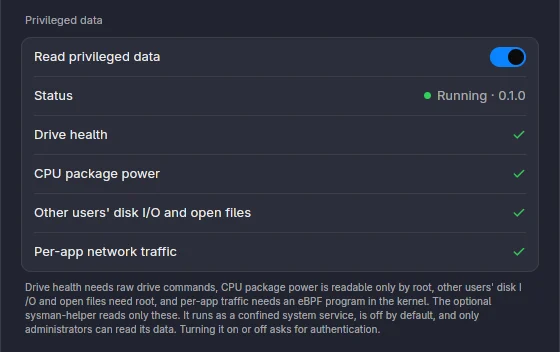
The app’s Settings, Advanced tab: Read privileged data switched on, the helper running, and drive health, CPU package power, other users’ disk I/O and open files, and per-app network traffic all available.
Settings → Advanced, with each privileged source checked.

FAQ

Questions, answered.

Something else? Open an issue on GitHub.

Does sysman need root?

No. The collector runs as a systemd user service and the app runs as you. A few readings are root-only in Linux (SMART health, CPU package power on most systems, other users’ disk I/O and open files, per-process network traffic); the app shows them as “not permitted” until you turn on the optional helper.

Does it send anything over the network?

No. There is no telemetry, no update check and no account. The app talks to the collector over a Unix socket and reads history from a local SQLite file; the helper runs with no network access at all.

Does it keep recording when the app is closed?

Yes. Recording is the collector’s job, and it runs from login whether the app is open or not. Open the app later and everything since is there, at full resolution for the last 48 hours.

How much does it cost to run?

About 2% of one core with the default settings. Some Super I/O sensor chips are expensive to read, so they are polled every 10 seconds instead of every 2. The crash log grows by roughly 290 KB a minute and only today’s and yesterday’s files are kept.

My machine froze or lost power. How do I find out why?

Open that day’s crash log and read the last lines before the gap. Climbing temperatures or falling fan speeds point at cooling; readings flat and normal to the very end point at the power supply or cabling; a burst of GPU errors first points at the GPU or its driver. Every start writes a record with the boot id, so a new id after a gap marks the reboot.

Which systems does it run on?

Linux on x86-64 with systemd, on AMD or Intel processors and NVIDIA, AMD or Intel graphics. The app needs a Wayland or X11 session with Vulkan. There are packages for Arch, Debian 12 or newer and Ubuntu 22.04 or newer, and an install script for other distributions.

Can I change what it collects and how long it keeps it?

Yes, in an optional config.toml; every setting has a default. Each module can be switched off or slowed down, and each history tier has its own retention. A misspelt section or key stops the collector with a message naming it, so a typo cannot silently switch something off.

~/.config/sysman/config.toml
[general]
interval = 2            # base tick in whole seconds
fsync = true            # force each crash-log line to disk

[retention]
raw_hours = 48          # full-resolution history
rollup_1m_days = 90     # 1-minute min/avg/max
rollup_15m_days = 730   # 15-minute min/avg/max

[modules.processes]     # every module also accepts enabled and interval
top_n = 20
Can I use the data in my own scripts?

Yes. The socket speaks line-delimited JSON with four requests: meta, latest, subscribe and processes. History is plain SQLite in WAL mode; open it read-only.

$ echo '{"cmd":"latest"}' | socat - UNIX-CONNECT:$XDG_RUNTIME_DIR/sysman.sock | jq .cpu
Where does it keep its files?
Config
~/.config/sysman/config.toml
History
~/.local/share/sysman/history.db
Crash log
~/.local/share/sysman/log/YYYY-MM-DD.jsonl
Socket
$XDG_RUNTIME_DIR/sysman.sock

XDG_CONFIG_HOME and XDG_DATA_HOME are honoured.

Is it free?

Yes. sysman is free and open source.